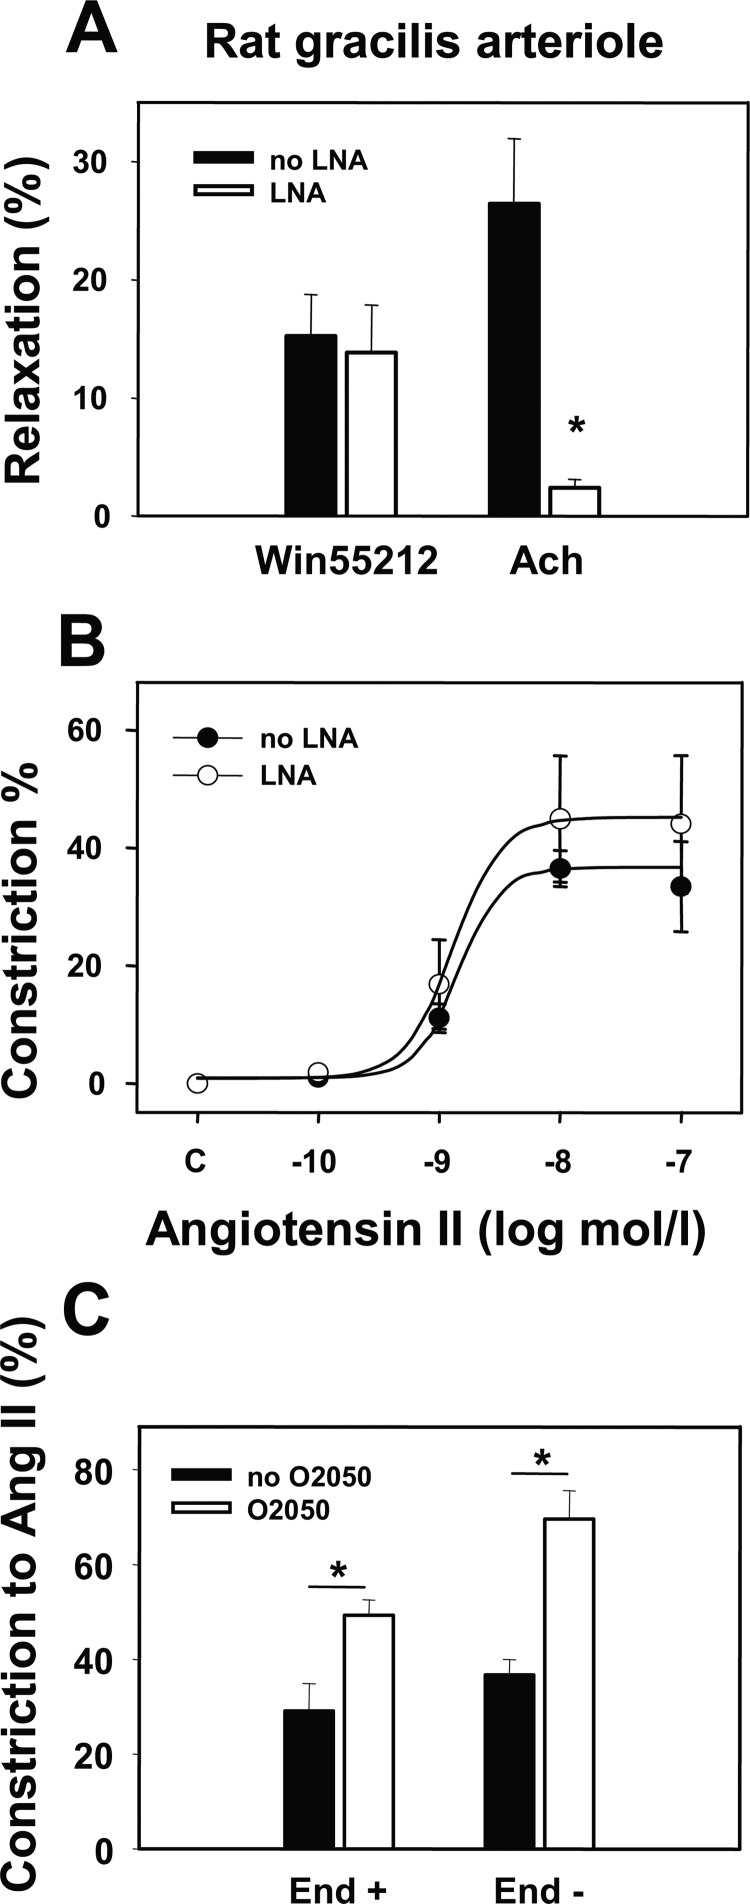
FIGURE 6.
Endothelial contribution to agonist-induced responses. Data were obtained by pressure arteriography on rat gracilis arterioles. A, shown is the effect of the NO synthesis inhibitor LNA (10 μm) on WIN55212 (1 μm) and Ach (10 μm)-induced vasodilations (n = 4–5). B, shown is the effect of pretreatment with LNA on the angiotensin II (Ang II)-induced vasoconstriction (n = 4–5). C, shown is the effect of the CB1R antagonist O2050 (1 μm) on the Ang II-induced (10 nm) vasoconstriction in segments with intact endothelium and after endothelial removal (n = 4–5). Values were calculated as percent change of diameter from control. Mean ± S.E. values are shown. Asterisks indicate significant changes of vessel tone in response to inhibitor treatment (p < 0.05).

