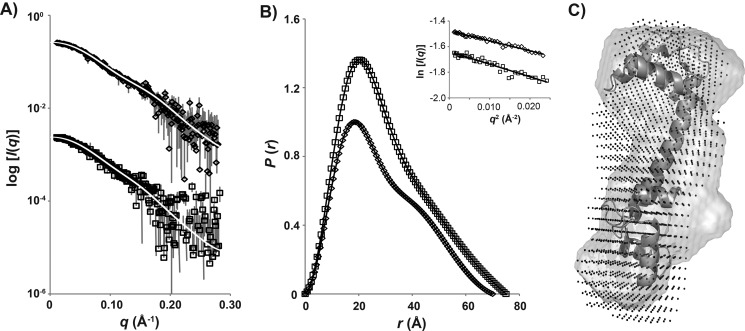
FIGURE 8.
SAXS profiles of Ca2+/CaM and Ca2+/CaM-Cpep complex. A, SAXS data as I(q) versus q for Ca2+/CaM (♢) and the Ca2+/CaM-Cpep complex (□) with the GNOM fits (white lines) superposed. The measured data were all placed on an absolute scale using scattering from water but are shown here multiplied on the I(q) axis for clarity. B, P(r) versus r calculated using the data in A and normalized to the ratio of the square of the molecular mass of each protein. The symbols are as for A, and error bars (not shown; corresponding to ± 1 S.D.) are smaller than the symbols. Inset, Guinier plots of the SAXS data for Ca2+/CaM (♢) and Ca2+/CaM-Cpep complex (□) and linear fits (line) to the data at qRg < 1.3. C, shape reconstructions of Ca2+/CaM and Ca2+/CaM-Cpep overlaid with the crystal structure of Ca2+/CaM. Crystal structure of Ca2+/CaM (PDB 1CLL) is shown in a ribbon diagram, and shape reconstructions of Ca2+/CaM alone and Ca2+/CaM-Cpep are shown as a gray surface and in black dots, respectively.

