FIGURE 3.
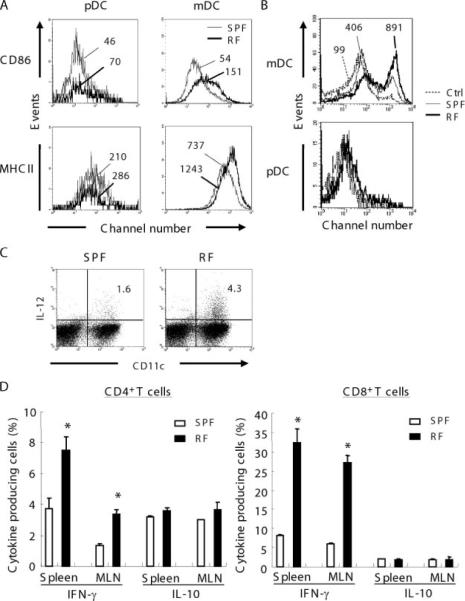
mDC maturation/activation phenotype and IFN-γ-producing T cells in RF mice. A, CD86 and MHCII expression on pDC or mDC were compared between SPF and RF mice. Thin line represents SPF and bold line represents RF mice. Numbers indicate MFI. B, Effect of lumenal lysate on bone marrow-derived DC. Bone marrow cells were cultured for 1 wk in the presence of Flt-3L, and lumenal lysate prepared from SPF or RF mice lumen contents were added and cultured for 24 h. CD86 data were gated on pDC (CD11c+B220+CD11b−) and mDC (CD11c+B220−CD11b+). Dotted line represents vehicle control and thin line and bold line represent SPF lumenal lysate and RF lumenal lysate, respectively. Numbers indicate MFI. C, IL-12 production from CD11chigh DC. Low-density cells from spleen of SPF or RF mice were cultured, stimulated with PMA/ionomycin, and stained with anti-IL-12 and anti-CD11c. Numbers are percentages of total low-density cells. Data are representative of at least three mice in two separate experiments. D, IFN-γ or IL-10 productions from T cells were compared between SPF and RF mice. Spleen cells prepared from SPF or RF mice were stimulated with PMA/ionomycin and stained with anti-IFN-γ or anti-IL-10. CD3ε+CD4+ cells were gated as CD4+ T cells and CD3ε+CD8+ were gated as CD8+ T cells. Values are the percentage of cytokine-producing cells among total CD4+ or CD8+ T cells. *, p < 0.01 for Student's t test comparing each group to SPF mice. Other comparisons are nonsignificant values (p ≥ 0.05).

