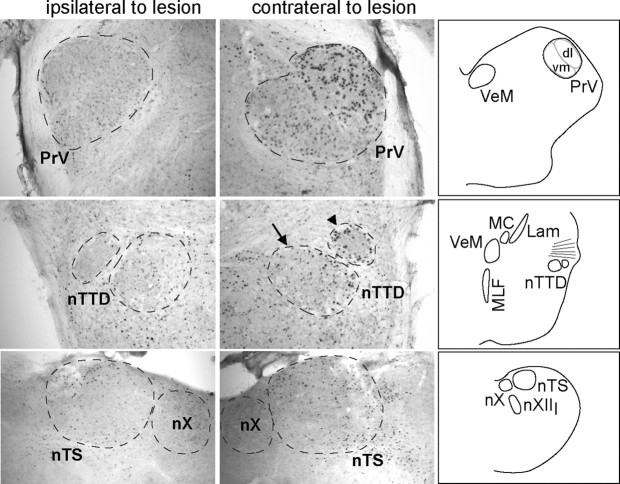
Figure 4.
Photomicrographs of PrV (top), nTTD (middle), and nTS (bottom). PrV and nTTD are from a bird with a lesion of the lingual branch of the hypoglossal nerve (XIIl); nTS is from a bird with a lesion of the vagus. Fos expression on the side ipsilateral to the nerve lesion (left) was low compared with the intact control side (contralateral to the lesion, right). Schematics at far right show corresponding levels of the brainstem. Separate dorsolateral (dl) and ventromedial (vm) portions of PrV could be visualized. Arrow in nTTD panel shows the region within nTTD that was traced and quantified; arrowhead shows a separate region that was analyzed qualitatively. Lam, Nucleus laminaris; MC, nucleus magnocellularis; MLF, medial longitudinal fasciculus; nX, dorsal motor nucleus of the vagus; VeM, medial vestibular nucleus. Scale bar, 300 μm.

