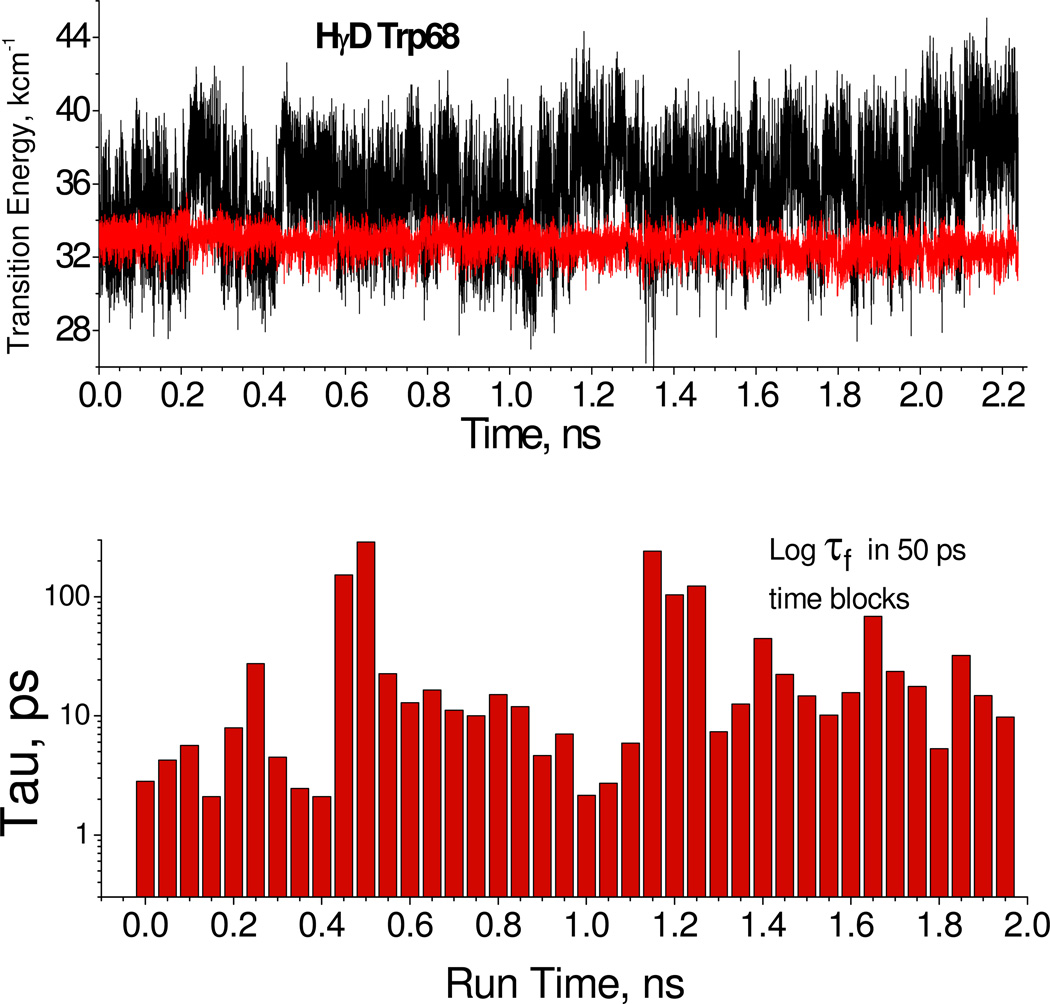
Figure 6.
Top 2.2 ns QM-MM Simulation of lowest CT (black) and 1La (red) state transition energies for Trp68 γD-crystallin with points shown every 1 ps. Bottom: Sequential 50-ps log10 average lifetimes based on the corresponding CT-1La energy gaps in the top figure. The heterogeneity suggested by the plot is consistent with that seen in the observed lifetimes.

