
Figure 1.
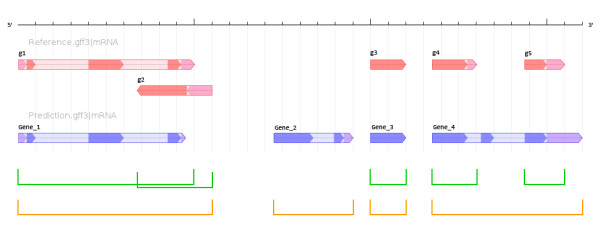
Associating Annotations with Gene Loci. The black bar provides a scale corresponding to a genomic region for which two sets of annotations are available. Reference annotations for gene structure are represented with red glyphs, while prediction annotations are shown with blue glyphs. Arrows indicate the strand of the gene annotation, and different levels of shading correspond to different gene structure features: dark shading for coding sequence, medium shading for UTRs, and light shading for introns. Green brackets denote gene loci as determined by the common practice of using only the genomic coordinates from reference gene annotations.Orange brackets denote gene loci as determined by ParsEval, which takes into account both reference and prediction annotations when selecting distinct loci for comparison