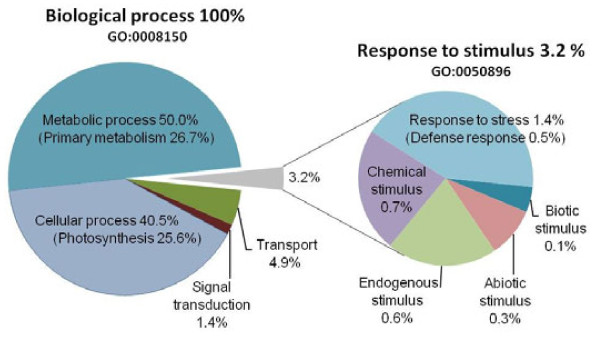
Figure 1 .
Functional distribution of all annotated Unitrans (>2 ESTs) based on their predicted Gene Ontology (GO) term. All GOs shown had at least 200 ESTs and an E value threshold of ≤1e-40 after annotation by the UniProt database. The left chart represents the five main groups of biological processes (GO first level), the right chart represents subcategories for “Response to stimulus” (GO second level), and “Response to stress” (in brackets, GO third level).

