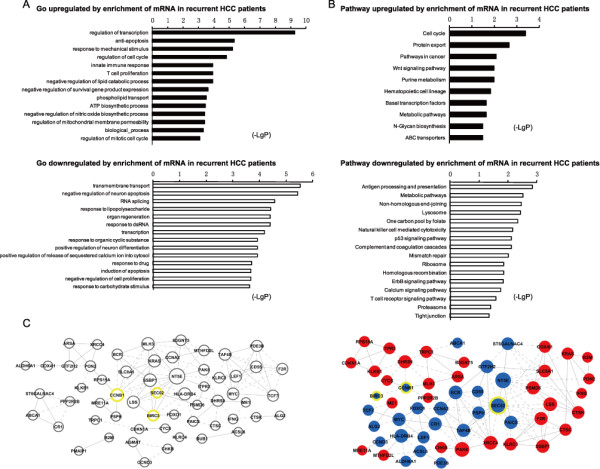
Figure 1.

GO and pathway ehrichment and interaction network analyses based on the set of 615 differentially expressed genes in the recurrent HCC and non-recurrent HCC samples. A. GO category based on the biological process for differentially expressed genes. (Upper) The significant GO category for the upregulated genes. (Below) The significant GO category for downregulated genes. LgP is the base-10 logarithm of the p value. B. KEGG pathway analysis for the differentially expressed genes. (Upper) The significant pathway for the upregulated genes. (Below) The significant pathway for the downregulated genes. C. Interaction network analysis of the 615 genes. The 615 altered genes were connected in a network based on prior known protein-protein interactions and signaling pathways. Blue, upregulated genes. Red, downregulated genes. The CCNB1, SEC62 and BIRC3 genes had the highest DiffK(i) values; therefore, they might be of great importance to HCC recurrence in these patients.
