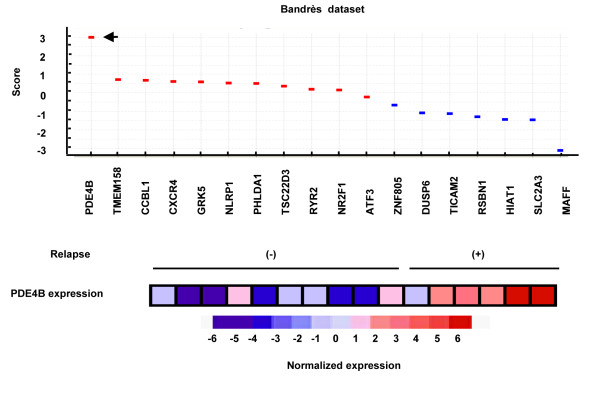
Figure 7.
Correlation between increased PDE4B expression and disease relapse in CRC patients. Differential expressions of 18 genes between colorectal tumor specimens from six CRC patients in the relapsed group and those from 10 patients in non-relapsed group in Bandrès dataset. Dots in upper panel represent the score (red, upregulated genes in relapsed group; blue, upregulated genes in non-relapsed group). Arrowhead represents PDE4B. Columns in lower panel represent normalized expression levels of PDE4B in 16 Dukes' B colorectal tumor specimens.

