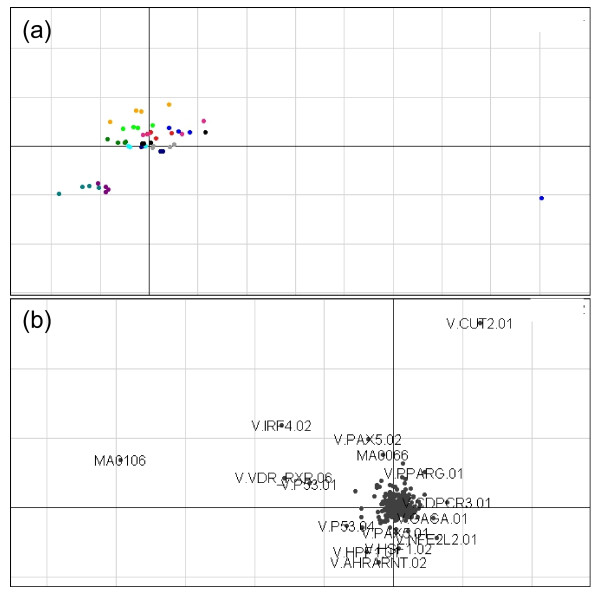
Figure 1 .
Axes 1 (horizontal) and 3 (vertical) of the unsupervised CIA for BT474 cell line data. A gene/TFBS frequency table produced with a PSSM threshold of 0.8 was used. (a) shows the projection of the cell line samples. The 0.1% DMSO treated samples (black 0 hr, red 2 hr, light blue 6 hr, light green 12 hr and orange 24 hr) and the 0.1 μM lapatinib treated samples (magenta 2 hr, dark blue 6 hr, cyan 12 hr and dark green 24 hr) are split from the 1 μM lapatinib treated samples (purple 6 hr and pale blue 12 hr). The exception being the four 1 μM lapatinib treated samples at 2 hours post treatment (grey). (B) Shows the projection of the TFBS motifs. Motifs that are in the same orientation (direction from the origin) as a group of samples are associated with those samples.

