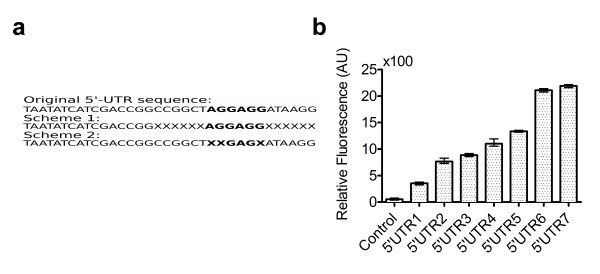
Figure 4.
Testing 5’-UTR strength. (a) Two schemes were used to mutate and create the 5’-UTR library. Bold face type region indicates the Shine-Dalgarno consensus sequence. The top sequence shows the original sequence 5’UTR taken from the RBS calculator. The X’s in the schemes show the locations of random point mutations. (b) The 5’-UTR strength was estimated by measuring RFP fluorescence of a truncated mf-Lon::mCherry reporter using the respective 5’-UTRs numbered 1–7. The control strain does not express RFP. Data points were measured with three biological replicates. Error bars indicate data range (highest and lowest value).

