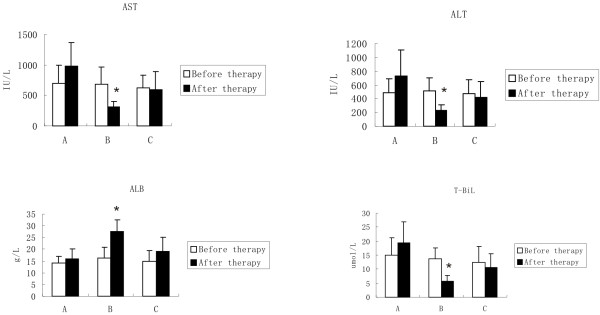
Figure 3.
Liver function test values. The histograms show AST, ALT, ALB and T-BiL changes before and after placebo/ADMSCs infusion in 3 different groups (A, the control group without ADMSCs; B, The portal vein group with ADMSCs; and C, The tail vein group with ADMSCs). Values are expressed as mean ± SD. *P < 0.05, after therapy versus before therapy.

