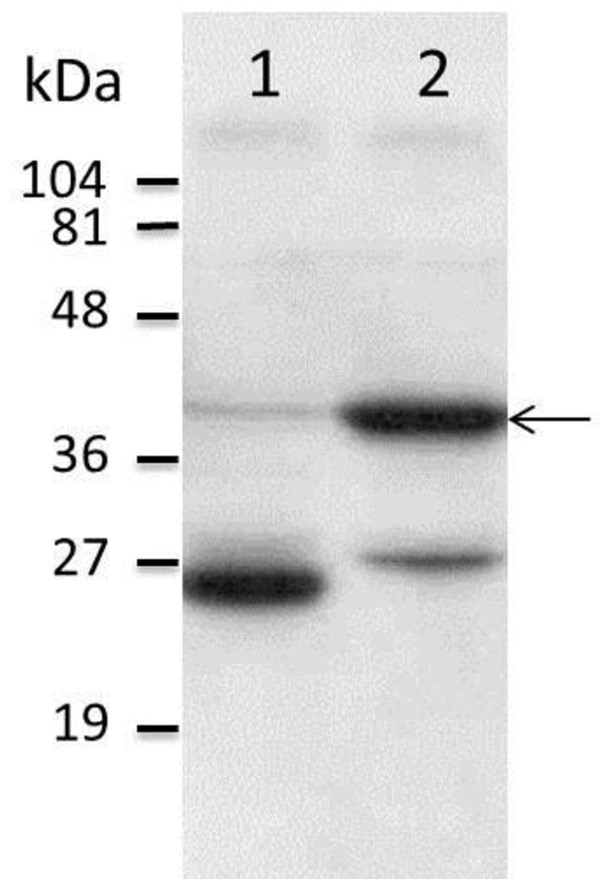
Figure 1.
Western blot showing protein expression of NSm. Figure 1 demonstrates a Western blot analysis of proteins expressed by yeast cells. The individual proteins were separated by SDS-PAGE and visualized by c-Myc monoclonal antibodies. Lane 1 shows the pGBKT7-”empty vector” control, (GAL4 DNA binding domain protein in fusion with the c-Myc epitope tag). Lane 2 shows the fusion protein expressed from construct pGBKT7-NSm (the NSm protein in fusion with the GAL4 DNA binding domain protein and c-Myc epitope tag). The arrow adjacent to lane 2 indicates a protein band corresponding to the size of the fusion protein. A molecular weight standard is shown next to the figure.

