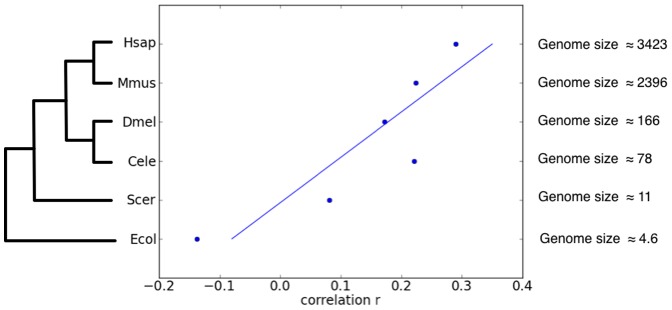
Figure 1. Duplicability-connectivity correlations vs. genome sizes and evolutionary relationship.
Spearman’s rank correlation coefficient ( ) between gene duplicability and gene connectivity for six species: H. sapien (Hsap), M. musculus (Mmus), D. melanogaster (Dmel), C. elegans (Cele), S. cerevisiae (Scer), and E. coli (Ecol). The evolutionary relationship of the species is based in part on [46]. Genome size (in Mbp) information for all species, except E. coli, were obtained from the Animal Genome Size Database and the Fungal Genome Database.

