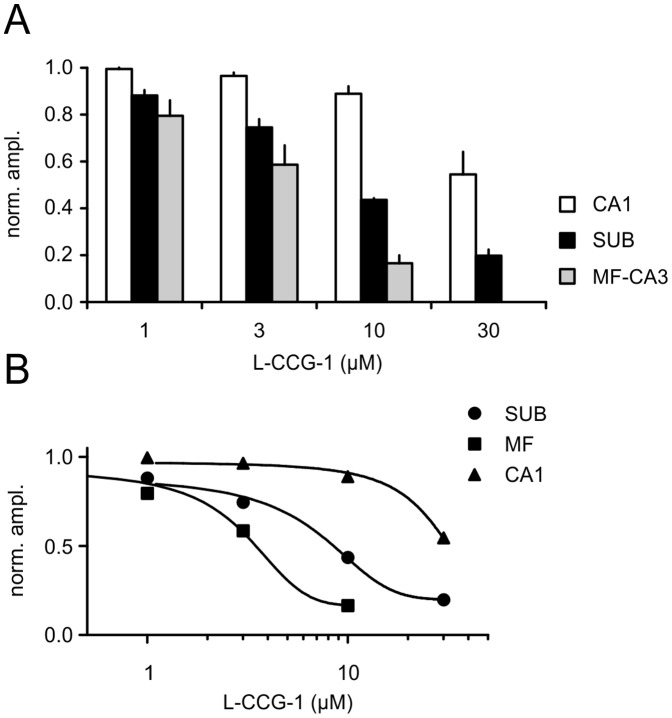
Figure 2. L-CCG-1 differentially depresses glutamatergic transmission in three different brain regions of the hippocampal formation.
(A)Summary bar diagram of the effects of different concentrations of L-CCG-1 in areas CA1, CA3 (MF) and SUB (SUB: n = 4; CA1: n = 5; MF-CA3: n = 6). (B) Data were fitted to a sigmoidal function and a dose-response curve is given for the SUB, MF-CA3 and CA1. EC50 values were estimated to 7 µM, 3 µM and 28 µM for the SUB, MF-CA3 and CA1, respectively. Error bars are not shown for clarity.

