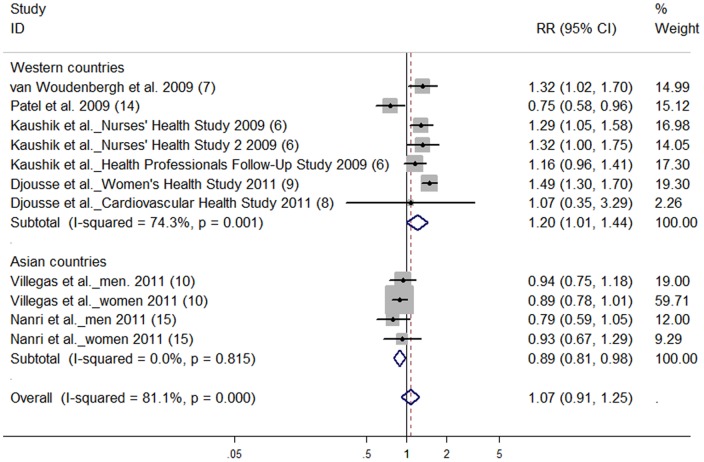
Figure 2. Relative risk of type 2 diabetes for highest vs lowest categories of total fish intake.
The combined relative risk was achieved using random-effects model. Grey square represents relative risk in each study, with square size reflecting the study-specific weight and the 95% CI represented by horizontal bars. The diamond indicates summary risk estimate.

