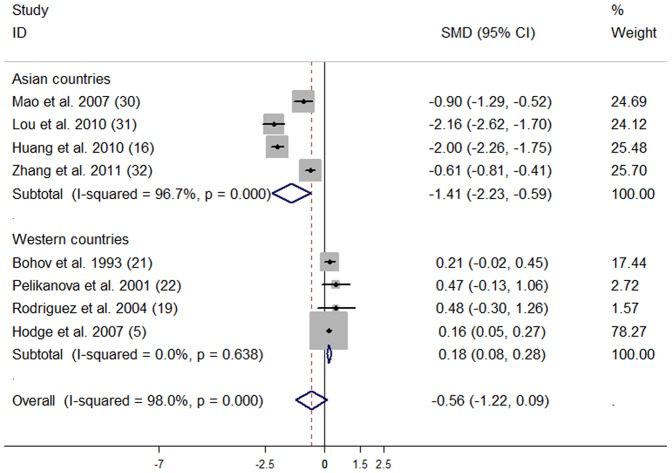
Figure 6. Effect of type 2 diabetes on tissue total n-3 PUFA composition compared with controls.
The combined standardized mean difference (SMD) was achieved using random-effects model. Grey square represents SMD in each study, with square size reflecting the study-specific weight and the 95% CI represented by horizontal bars. The diamond indicates summary SMD.

