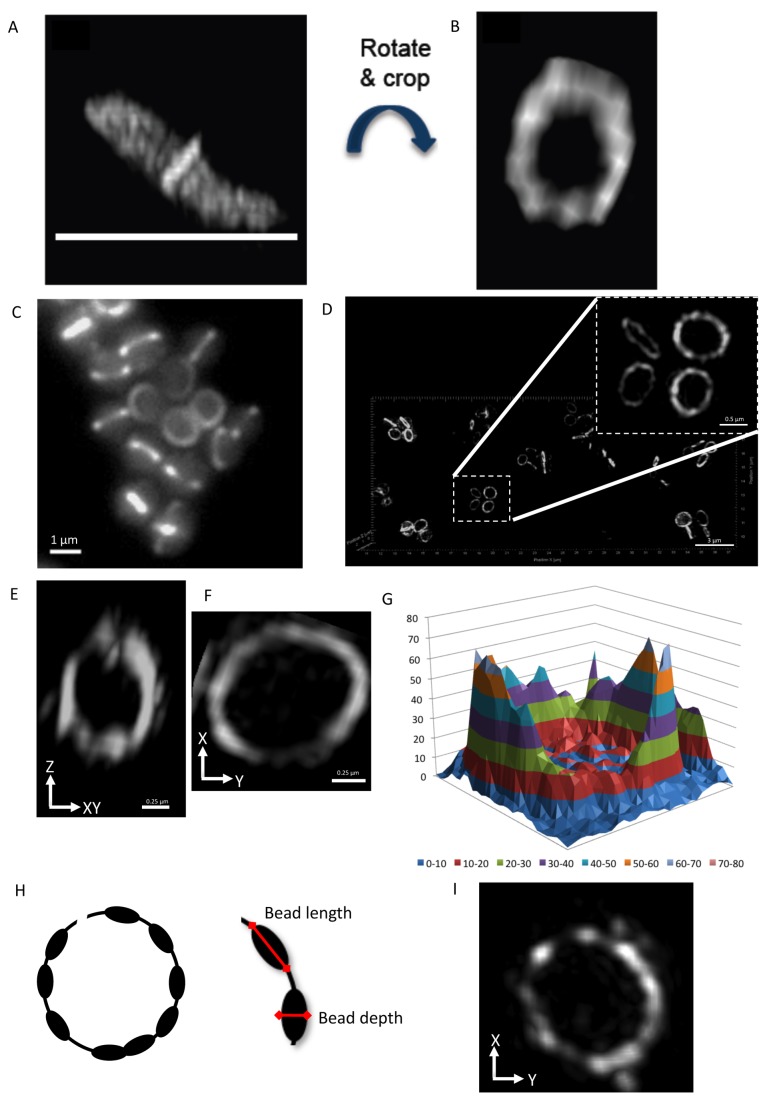
Figure 3. Z ring structure in S. aureus and B. subtilis.
(A and B) When the Z ring is examined closer to the x-y orientation in B. subtilis, it reveals that it is heterogeneous throughout the entire Z ring (white line represents microscope slide). Z ring diameter, 0.8 µm. (C and D) S. aureus expressing FtsZ-GFP cells (SA94) visualized using conventional wide-field fluorescence image (Zeiss) and 3D-SIM (acquired using OMX V3), respectively. (E) The appearance of the Z ring in SA94 cells imaged in the axial orientation with 3D-SIM. (F) A close up image of a Z ring in SA94 cells imaged in the lateral orientation with 3D-SIM (OMX V3). (G) A 3D intensity plot shows how the relative abundance of FtsZ-GFP in all regions of the Z ring shown in panels (F) and (H). A graphical representation of the heterogeneous Z ring in S. aureus. Red arrows indicate dimensions used for measuring bead size and width in S. aureus cells. (I) 3D-SIM (OMX V3) image of the Z ring visualized using 1∶100 dilution of anti-FtsZ antibodies. S. aureus SA94 cells were grown in L-broth induced with 0.05 mM IPTG.

