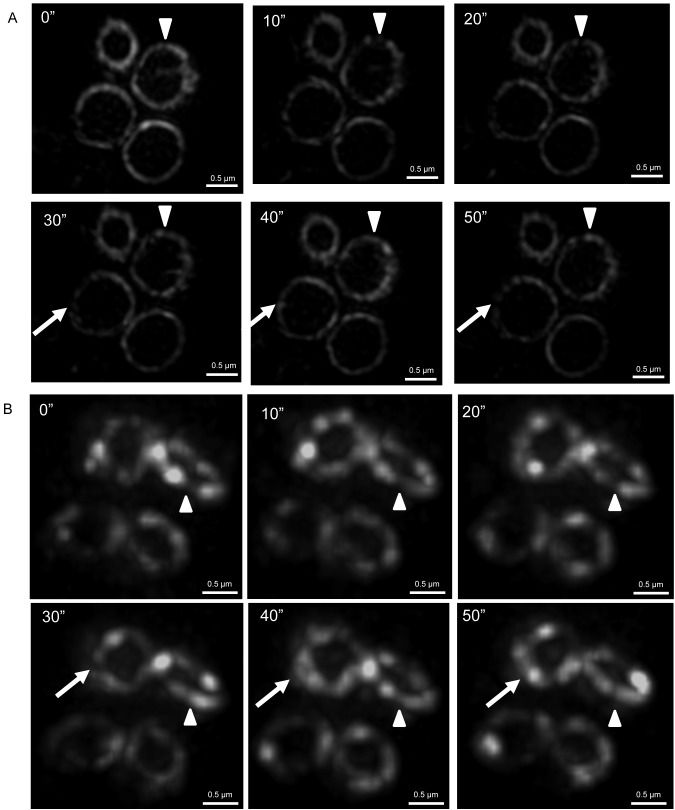
Figure 5. Z ring dynamics in S. aureus.
(A) 3D-SIM (OMX Blaze) time-lapse images show how FtsZ localization changes within the Z ring in S. aureus RN4220 cells (SA89). A white arrowhead marks the position of a gap when it initially forms inside the Z ring. The subsequent position of the arrowhead in each time point does not change and indicates how FtsZ is redistributed to a region of the Z ring, which previously had very little FtsZ present. White arrows indicate the formation of additional gaps in the Z ring. (B) Deconvolution time-lapse microscopy of SA94 cells expressing FtsZ-GFP. Time (s) is indicated on the upper left-hand side for each image. Cells were grown in L-broth at 37°C in the presence of 0.05 mM IPTG.

