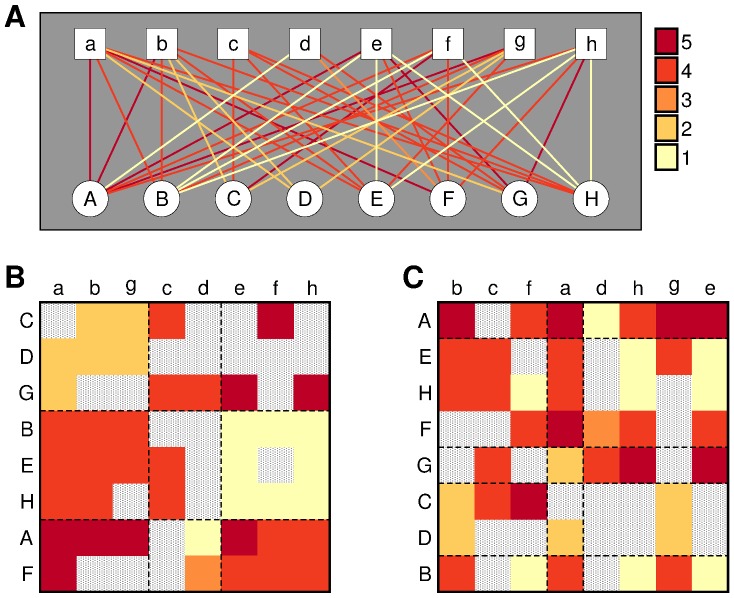
Figure 1. Predicting preferences using stochastic block models.
(A) Users A–H rate movies a–h as indicated by the colors of the links. (B-C) Matrix representation of the ratings; patterned gray elements represent unobserved ratings. Different partitions of the nodes into groups (indicated by the dashed lines) provide different explanations for the observed ratings. The partition in (B) has much explanatory power (low  ) because ratings in each pair of user-item groups are very homogeneous. For example, it seems plausible that C would rate item a with a 2, given that all users in the
  group give a 2 to all items in group
  . Conversely, the partition in (C) has very little explanatory power. According to Eq. 4, the predictions of (B) contribute much more than those of (C) to the inference of unobserved ratings.

