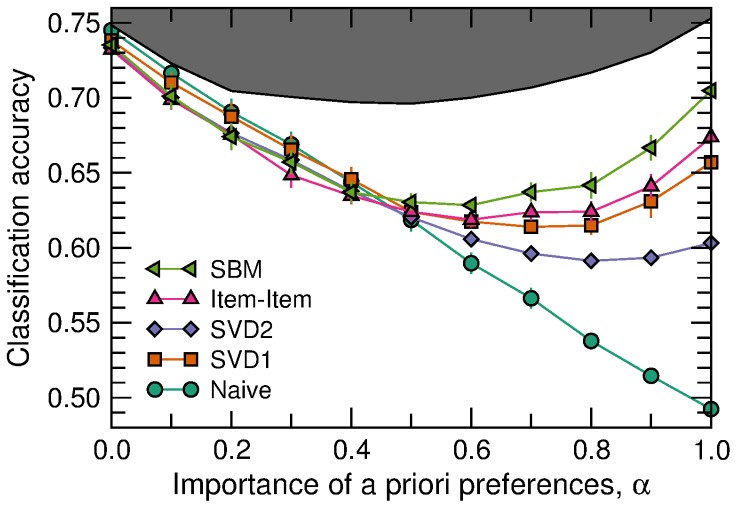
Figure 2. Algorithm comparison for model ratings.
We show the prediction accuracy (that is, the fraction of correct rating predictions) as a function of the parameter  that measures the importance of a priori preferences as opposed to intrinsic item quality (see text for details). The black line represents the optimal prediction accuracy, which would be obtained if the algorithms were able to estimate exactly the probability of each rating. For all the simulations we use:
  users organized in 5 groups;
  items organized in 5 groups;
  uniformly distributed in
  ; 4,000 observed ratings; and 1,000 ratings in the test set.

