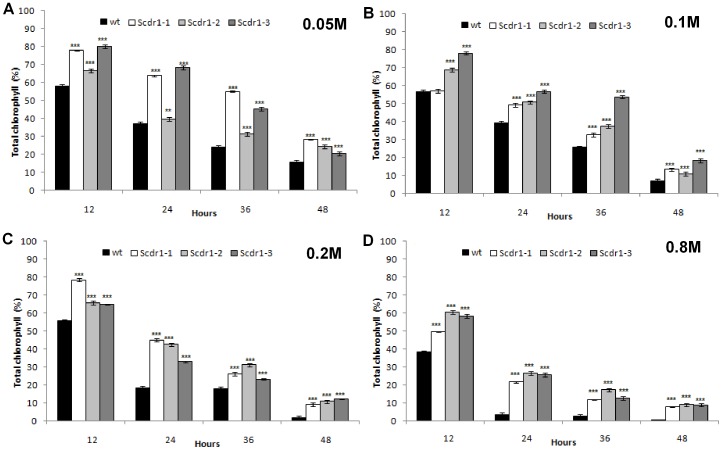
Figure 11. Spectrophotometric quantification of the chlorophyll content in WT and Scdr1 plants exposed to oxidative stress.
Leaf discs (1 mm) from three independent Scdr1 transgenic lines (Scdr1-1, Scdr1-2, Scdr1-3) and non-transgenic control plants were treated with water (control) or with different concentrations of H2O2: A) 0.05 M, B) 0.1 M, C) 0.2 M and D) 0.8 M. The total chlorophyll content in acetone extracts of H2O2-treated leaf discs was evaluated spectrophotometrically. Error bars were calculated from three independent experiments (n = 5). Asterisks (*** and **) indicate significant differences compared with WT plants in each treatment (P<0.0001 and P<0.001 respectively).

