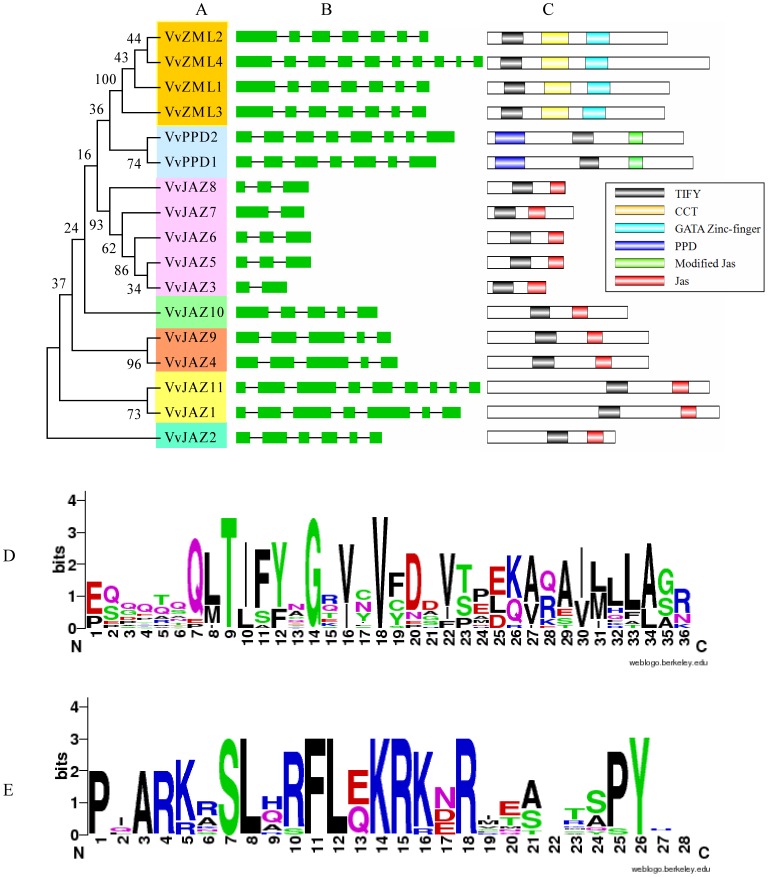
Figure 2. The ZML, PPD and JAZ protein subfamilies in grape.
(A) Phylogenetic analysis of grape ZML, PPD and JAZ proteins. Numbers above or below branches of the tree indicate bootstrap values. (B) Exon/intron structures of grape ZML, PPD and JAZ genes. Only the exons, represented by green boxes, are drawn to scale. Black lines connecting two exons represent introns. (C) The distribution of conserved domains within grape ZML, PPD and JAZ proteins. The relative positions of each conserved domain within each protein are shown in color. (D) Sequence logo of the TIFY (D) and Jas (E) domains from grape TIFY proteins.

