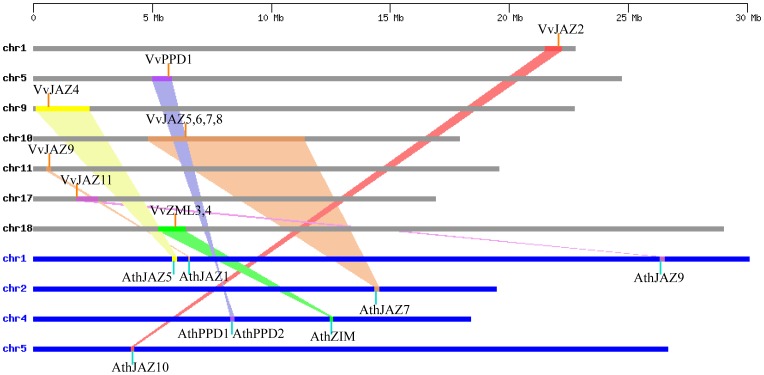
Figure 4. Synteny analysis of ZML, PPD and JAZ genes between grape and Arabidopsis.
Grape and Arabidopsis chromosomes are depicted as horizontal gray and blue bars, respectively. Grape and Arabidopsis TIFY genes are indicated by vertical orange and blue lines, respectively. Colored bars denote syntenic regions between grape and Arabidopsis chromosomes; a twisted colored bar indicates that the syntenic regions are in opposite orientations.

