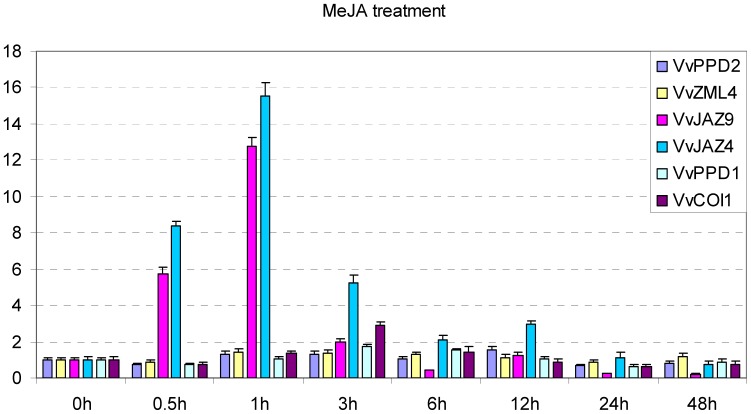
Figure 6. Expression levels of TIFY genes and VvCOI1 following MeJA treatment in the leaves of Chinese wild Vitis pseudoreticulata ‘Hunan-1’.
Grape Actin1 was used as internal control for qRT-PCR and fold changes indicate expression level in treated leaves compared with negative control, which was set to 1. Mean values and SDs were obtained from three technical and three biological replicates.

