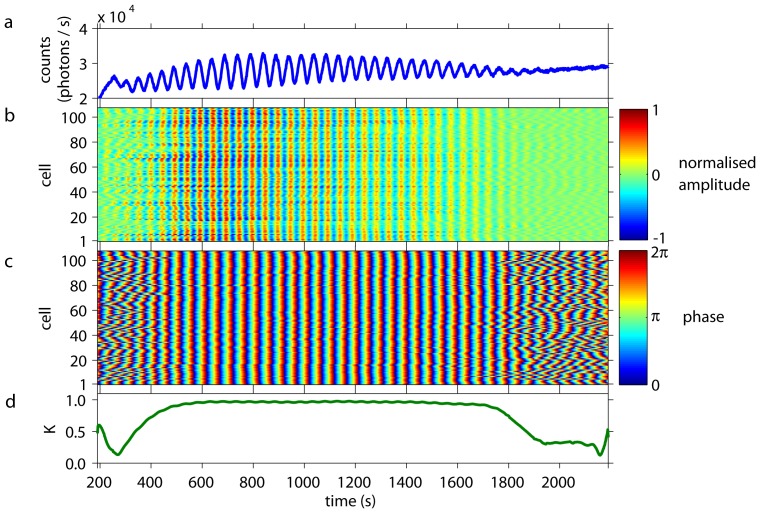
Figure 1. Collective and individual dynamics of a population of cells from S. carlsbergensis at a cell density of 0.7%.
At  = 0 an aliquot of 52 mM glucose was added to the starved and immobilised cells. During the first
  350 s of the time-series, the cells start to oscillate and to synchronise to each other. (a) The time-series of the macroscopic, collective fluorescence signal shows well-developed glycolytic oscillations. This coherent signal is generated by all cells of the population. (b) The oscillations of the individual cells show that their normalised amplitudes are highly coherent and synchronised. (The amplitude of oscillations of the cells corresponds to 60–140 photons/s.) Note that the dynamics of every cell is plotted as a thin line and its corresponding normalised amplitude is colour-coded. Cells are numbered randomly, i.e., the numbering does not reflect any spatial arrangement of the cells. At
  1800 s the oscillation amplitudes decay and the cells lose synchrony due to exhaustion of glucose. (c) The phases of the oscillations of the individual cells are highly synchronised to each other. Again, for
  1800 s the cells desynchronise. (d) The time-dependent Kuramoto order parameter
  indicates the degree of synchronisation among the cells. For 350 s
 1800 s the order parameter is almost 1, indicating a very high coherence in the oscillations of the individual cells.

