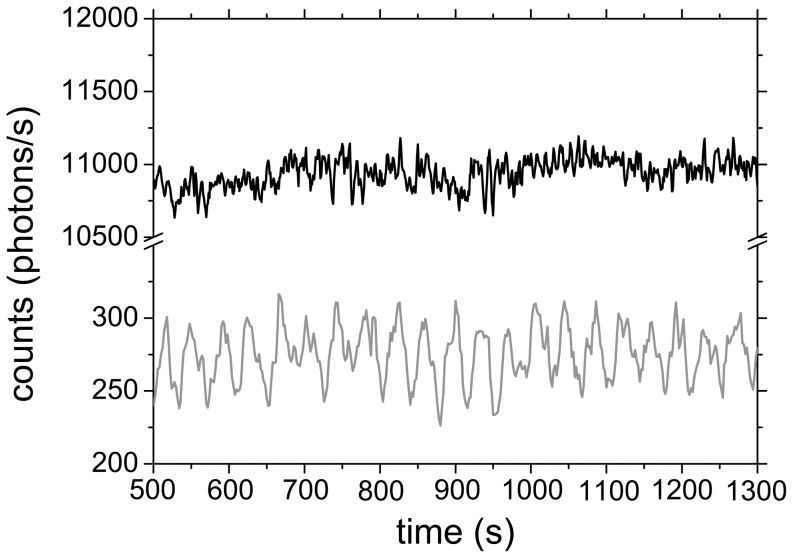
Figure 2. Dynamics of a S. carlsbergensis population of very low density (.
 = 0.001%). At
  = 0 an aliquot of 52 mM glucose was added to the starved and immobilised cells. While the collective signal (black line) is quiescent and noisy, long-lasting oscillations are observed in the fluorescence signal emitted by an individual cell (gray line). The original time series were smoothed by adjacent averaging over three consecutive data points.

