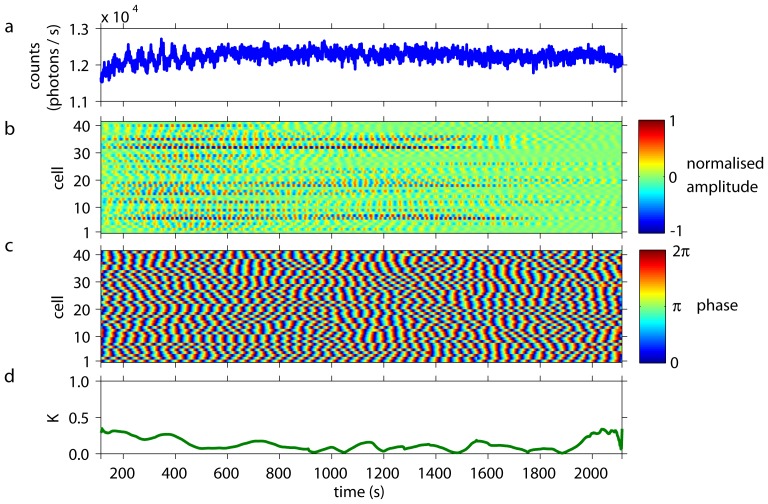
Figure 3. Collective and individual dynamics of S. carlsbergensis at a cell density of 0.01%.
At  = 0 an aliquot of 52 mM glucose was added to the starved and immobilised cells. (a) The time-series of the macroscopic, collective fluorescence signal is noisy but quiescent. Transient reminicences of oscillations can be spotted at 200 s
 400 s. (b) The individual cells remain oscillatory, even at this low cell density. The normalised oscillation amplitudes of the individual cells are decoherent. The amplitude of the oscillations of the cells corresponds to 120–200 photons/s.) Note, that the time spans where individual cells show pronounced oscillatory amplitudes vary considerably from cell to cell. The cells are numbered in a random order. (c) The plot of the phases of the oscillations shows that each cell oscillates, however, with its own phase and oscillation period. A slight and transient entrainment in the oscillation phases may be observed for some cells, giving rise to the reminicences of oscillations seen at collective signal at 200 s
 400 s. (d) The time-dependent Kuramoto order parameter
  remains low at all times, indicating a complete desynchronisation among the oscillations of the individual cells.

