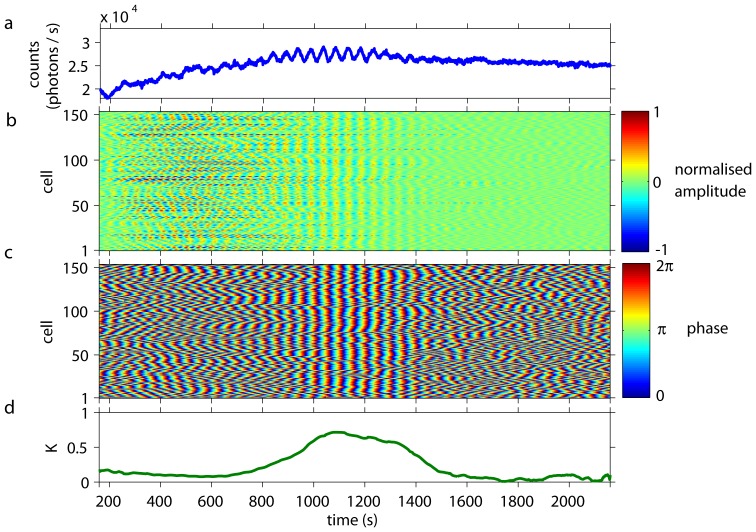
Figure 4. Collective and individual dynamics of S. carlsbergensis at a cell density of 0.1%.
At  = 0 an aliquot of 52 mM glucose was added to the starved and immobilised cells. (a) The time-series of the macroscopic, collective fluorescence signal is quiescent. At
  = 850 s a transient episode of synchronised, collective oscillations sets in. After 1350 s, the collective signal becomes quiescent again. (b) The individual cells remain oscillatory during the entire duration of the experiment. Remarkably, the synchronisation episode sets in as the normalised amplitudes of the glycolytic oscillations already diminishes. (The amplitude of the oscillations of the cells corresponds to 45–95 photons/s.) The cells are numbered in an random order. (c) At the begin and end of the experiment, the individual cells oscillate at their own periods and phases. The synchronisation episode at 850 s
 1350 s is caused by a temporary entrainment of the oscillations of the individual cells. (d) The time-dependent Kuramoto order parameter reflects the dynamics in the cell population. It remains below
  0.3 as the cells oscillate in a incoherent manner, and increases to levels of
  0.7 during the synchronisation episode.

