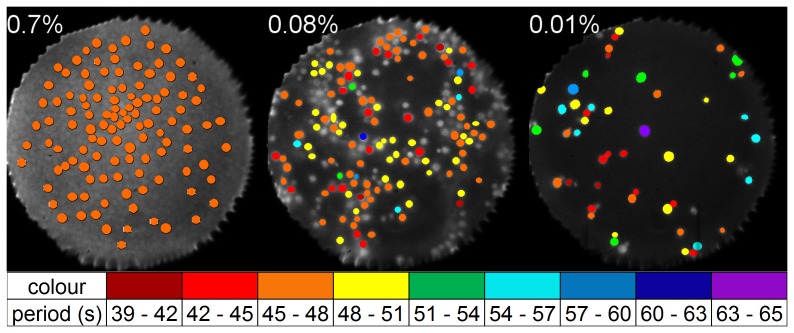
Figure 5. Mapping of the oscillation periods of individual cells in a population, for three experiments at cell densities of 0.7%, 0.08% and 0.01%, respectively.
While for high cell densities (e.g.  = 0.7%; not all cells labelled) all cells show same the oscillation period, the cells lose coherence in oscillation periods at lower cell densities (
 = 0.08% and 0.01%). Regions, where all cells of the cluster oscillate with same period, are not found in populations of low densities (
 = 0.08% and 0.01%). At densities below
  = 0.3%, domains devoid of cells are present in the areas of observation. Marked cells without colouration did not show distinctive oscillations. The field of view has a diameter of 169
 m.
m.

