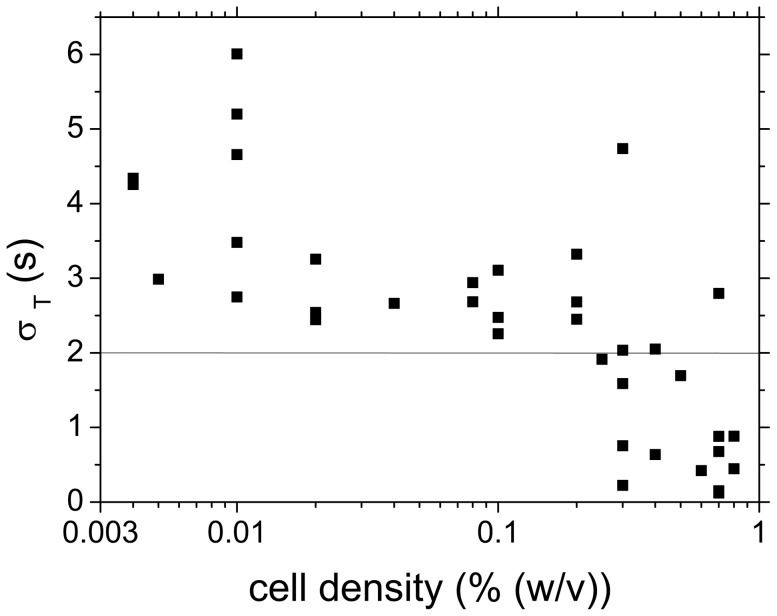
Figure 6. Width of the distribution of oscillation periods in individual experiments, as measured by the standard deviation .
 of the Gaussian fit to the histogram of oscillation periods. For cell densities
  below
below  = 0.3%,
  2 s pointing at decoherence in oscillation periods. The line at
  indicates the sampling rate (2 s). All points below
  = 2 s originate from coherent oscillations of the individual cells.

