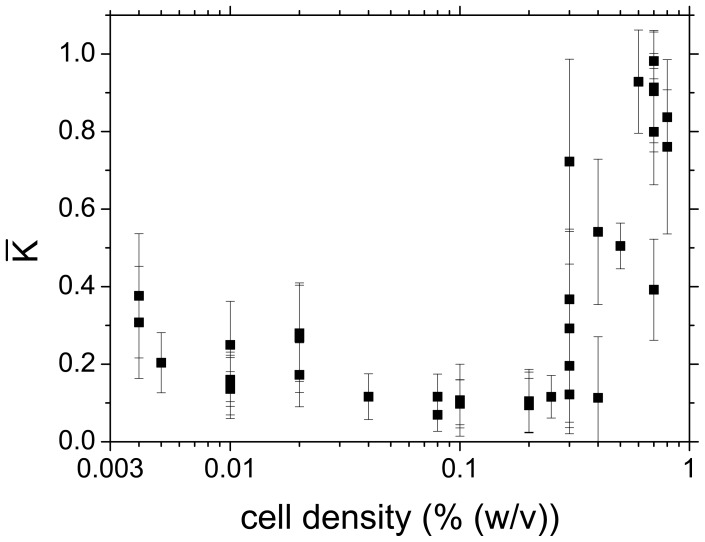
Figure 7. Time-averaged Kuramoto order parameter .
 for experiments at different cell densities
 . At cell densities above 0.3%,
  is high indicating coherent oscillatory dynamics of the cells in the population. At cell densities below 0.3% the low value of
  shows that the cells oscillate in a decoherent fashion. The critical cell density lies at
 0.3%. The error bars represent the standard deviation
  and provide a measure for the fluctuations of the phase synchronisation in each individual experiment.

