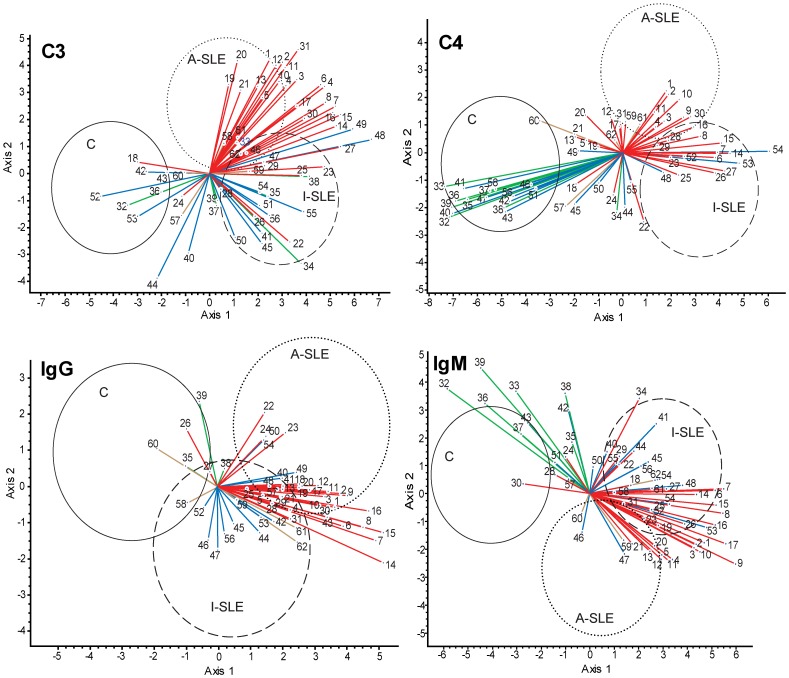
Figure 1. Canonical variates analysis (CVA) of binding data.
Binding data of C3, C4, IgG and IgM were used to generate a canonical space, defined by axis 1 and axis 2, from the discriminant functions derived through eigenanalysis. Coordinates of observations for the three study groups (control, C; active SLE, A-SLE; inactive SLE, I-SLE) in this canonical space are enclosed within the ellipsoids with a 95% confidence. Vectors represent correlations of variables (antigens) with the canonical axes and are superimposed on the ordination of observations: the length and directionality of these vectors offer a possibility to evaluate the relative influence of antigens upon the separation of groups. For example, the vector of C3 binding data of antigen 8 separates group A-SLE and I-SLE from group C but not A-SLE and I-SLE from each other. Antigen groups are color-coded: all nuclear materials (nucleic acids and nuclear proteins), red; collagens, green; complement, blue; lipids, brown. The complete list of antigens shown here is found in Table 2.

