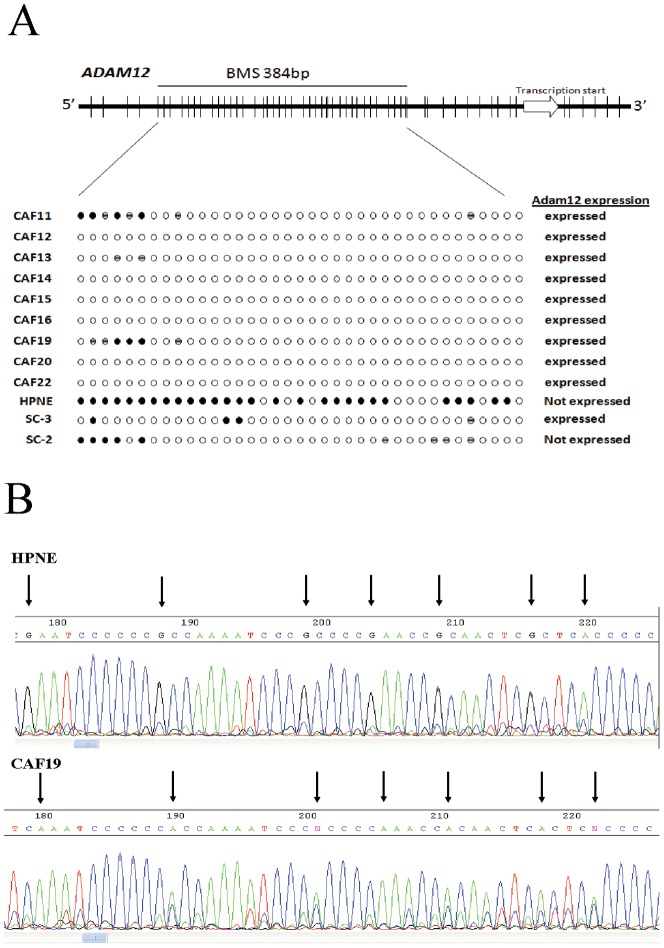
Figure 5. Bisulfite sequencing analysis of ADAM12.
(A) Top: ADAM12 gene structure and distribution of CpG dinucleotides. Short vertical bars represent CpG sites. Arrow points to transcriptional start site. Below: Bisulfite genomic sequencing analysis in pancreatic CAFs and control fibroblasts. Open circles represent unmethylated CpG sites, solid black circles methylated CpG sites, and hatched circles partially methylated CpG sites. (B) Bisulfite sequencing chromatograms of the ADAM12 promoter in a pancreatic CAF (CAF19) and control fibroblast line (HPNE). Arrows point to cytosine residues.

