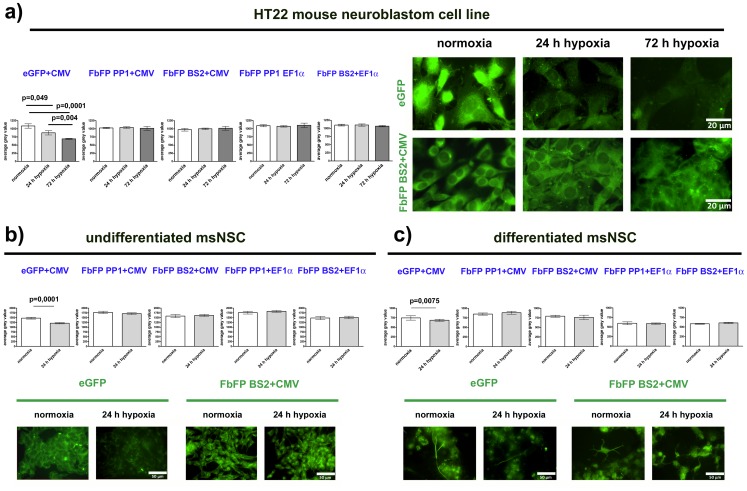
Figure 2. Fluorescence intensity of FbFPs under normoxic and hypoxic conditions.
In a: The left panel shows average grey values as an indicator for fluorescence intensity in the HT22 cell line under normoxic conditions and after 24 or 72 hours of hypoxia. The right panel shows photomicrographs of stably transfected HT22 cells at indicated oxygen saturations. In b+c: average grey values in undifferentiated msNSCs or differentiated msNSC under normoxic conditions and after 24 or 72 hours of hypoxia are shown together with photomicrographs of stably transfected cells at indicated oxygen saturations. P-values are given for results of unpaired two-tailed t-test results of normoxic vs. hypoxic conditions. White bars, light or dark grey bars illustrate values under normoxic conditions, 24 or 72 hours hypoxia, respectively.

