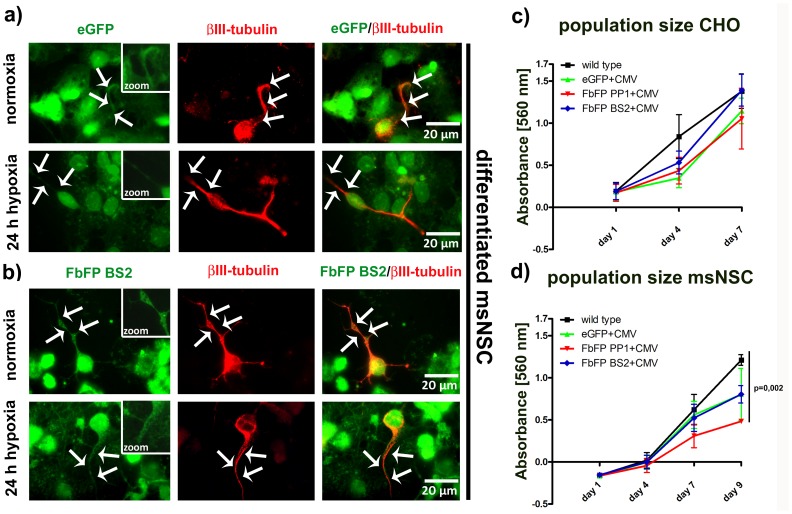
Figure 3. Neuronal transgene expression under hypoxic conditions and population size after stable eGFP or FbFP transfection.
In a+b: To specifically verify neuronal transgene expression after neural stem cell differentiation, βIII-tubulin immuno-staining was applied. Photomicrographs in the first column show the transgene (green) eGFP or FbFP BS2. In the second column, βIII-tubulin immuno-staining (red) is shown and in the third column the merged picture. The transgene expression is illustrated under normoxic or hypoxic conditions. To better visualize transgene expression in critical structures in which the eGFP signal decreases under hypoxic conditions, white arrow heads are inserted that flank neurites of the neurons. Boxes show parts of neurites marked by the white arrow heads in a higher magnification. In c+d: Population size of stably transfected CHO cells and mouse neural stem cells are given. Cells were seeded at an equal density and monitored over a time period of 7 to 9 days (x-axis). Measurement values of the MTT-assay (y-axis) are given for each measurement day. Wild type cells were compared to stably transgene expressing cells.

