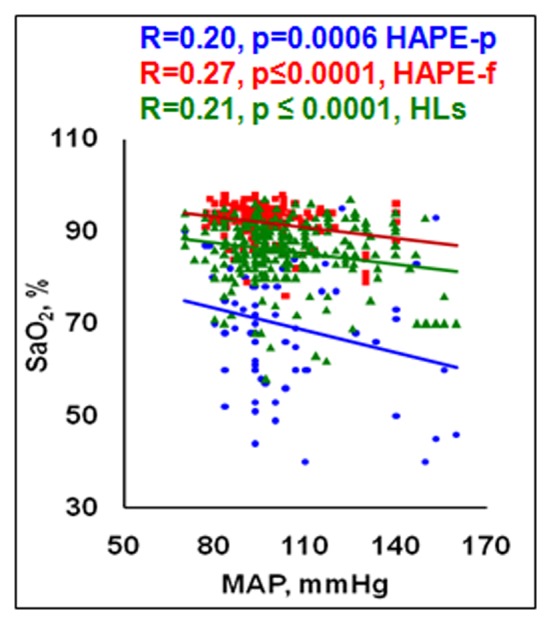
Figure 2. Clinical correlations in the three groups i.e. HAPE-p, HAPE-f and HLs.

An inverse correlation was obtained between the clinical parameters viz MAP and SaO2 in the three groups; MAP, mmHg; SaO2, %.

An inverse correlation was obtained between the clinical parameters viz MAP and SaO2 in the three groups; MAP, mmHg; SaO2, %.