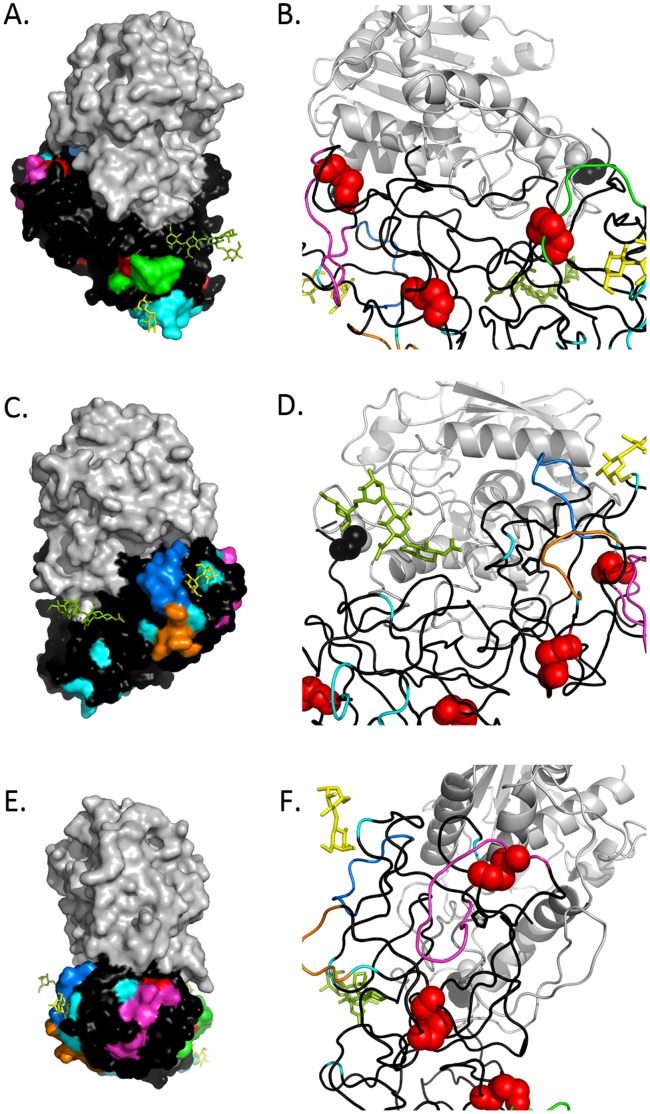
Figure 10. Modeling of proposed B cell epitopes on RTB.
We used PyMOL and PBD accession AAI2 to model using surface (left, panels A,C,E) and secondary structure (right, panels B,D,F) depictions of the epitopes recognized by indicated mAbs. Panels A and B: depiction of the epitope recognized by 24B11 (green); panels C and D; depiction of the epitopes recognized by C/M A2 (orange) and JB4/SylH3 (marine blue); panels E and F the epitopes recognized by B/J F9 (magenta). Highlighting common to all panels include RTA (grey), RTB (black), regions of amino acid differences between RCB and RTB (cyan), disulfide bonds (red), mannose side chains (olive green), and lactose (yellow) situated within CRDs.

