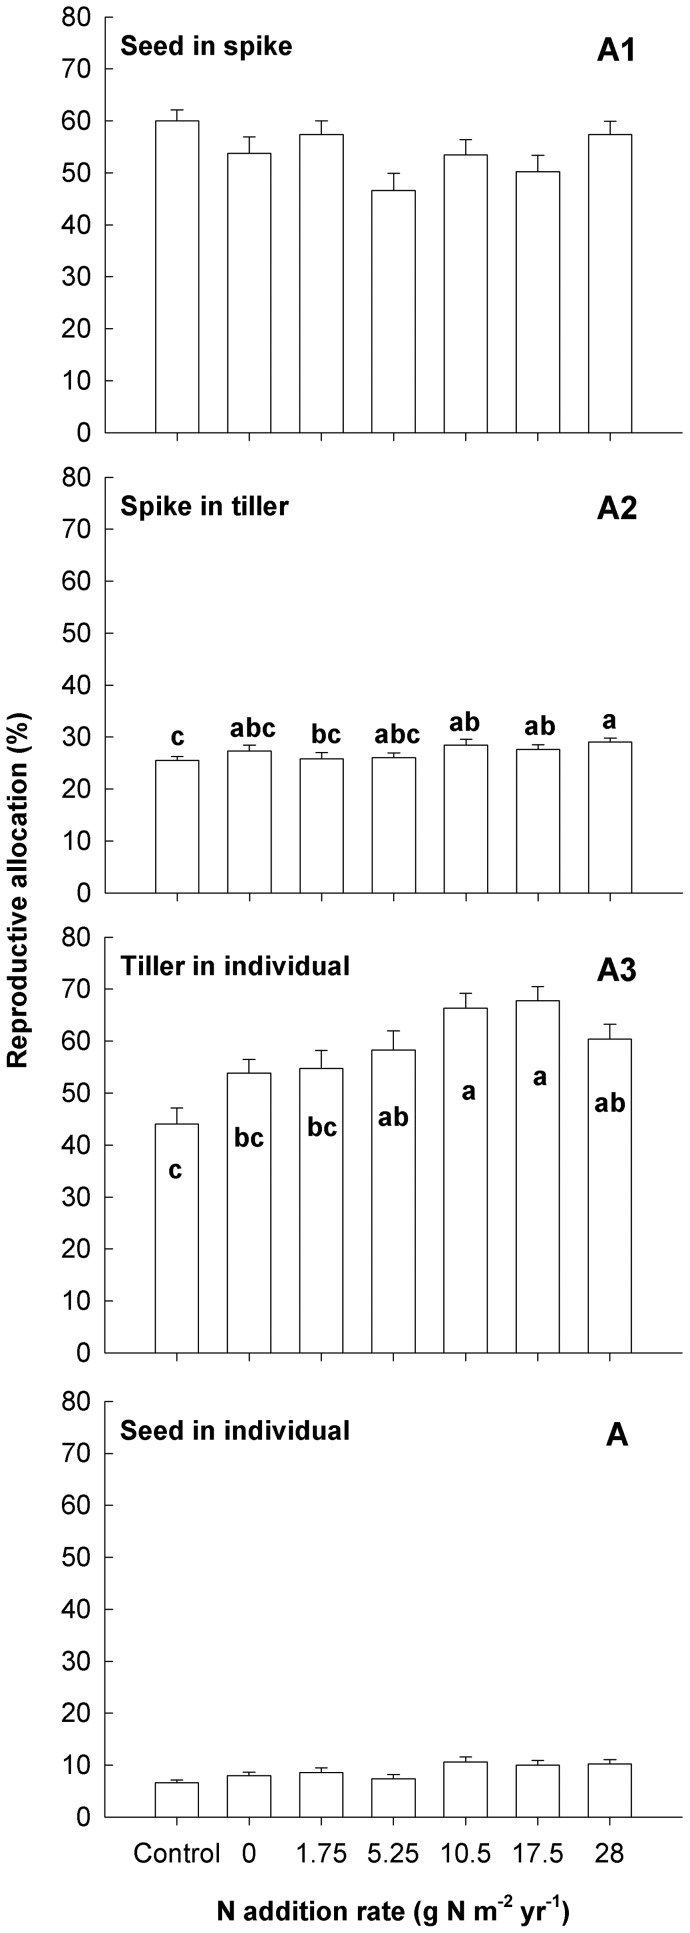
Figure 5. Effects of nutrient addition on biomass reproductive allocations (RAs) of A. cristatum at the spike (A1), tiller (A2) and individual (A3) levels and final RA (A) at the whole plant level.
RA for each treatment is the average of 45 replicates (error bars indicate s.e.). Bars followed by the same letters are not significantly different according to LSMEANS at P = 0.05.

