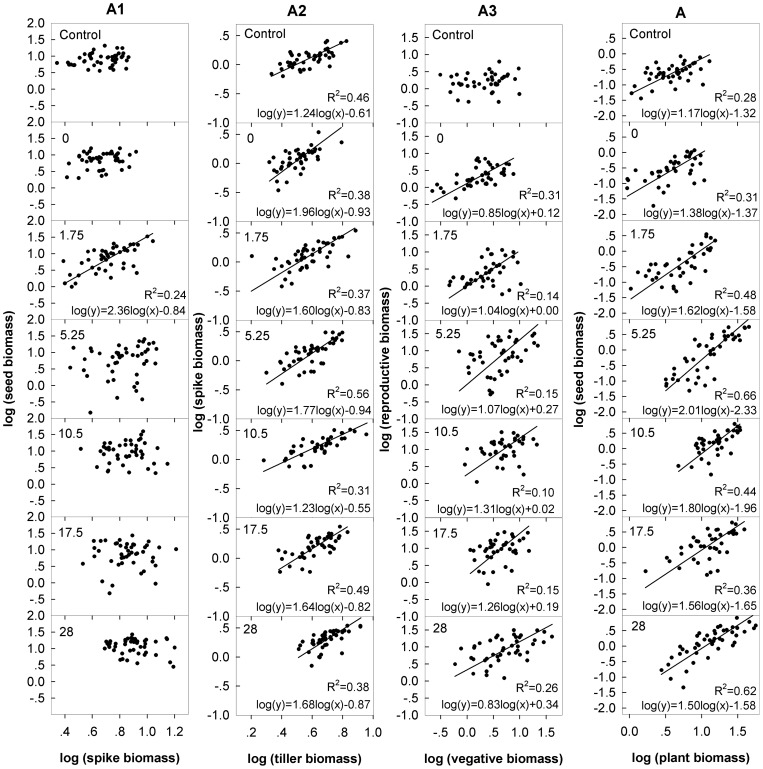
Figure 6. Allometric relationships of seeds vs. non-seed components at the spike level (A1), spike vs. non-spike components at the tiller level (A2), reproductive tillers vs. vegetative tillers at the individual level (A3) and seeds vs. non-seed components at the whole plant (A) level for control and N addition rates at 0, 1.75, 5.25, 10.5 and 28 g N m−2 yr−1.
Subplots without regression indicates that there is no significant allometric relationship at P = 0.05.

