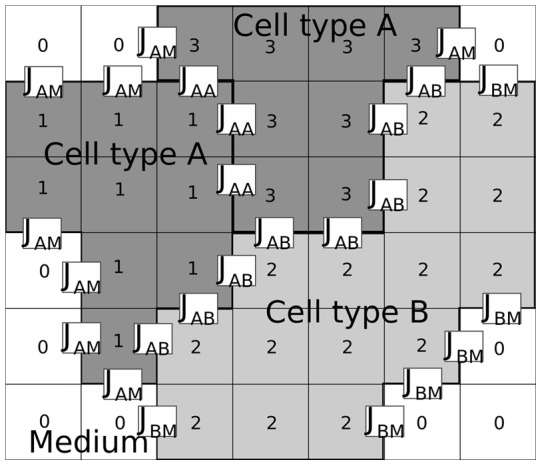
Figure 1. Cell-surface interaction in the cellular Potts model is regulated by the surface energy coefficients.

Three cells with cell indices 1, 2 and 3, respectively, each one covering several lattice sites, interact with each other at the cell surfaces. The cells 1 and 3 are of type A, depicted in dark grey, the cell 3 is of type B, depicted in light grey. The strength  of the interaction depends on the cell types. There are also interactions between the cells and the medium (white, cell index 0). Possible boundary interactions are not shown.
