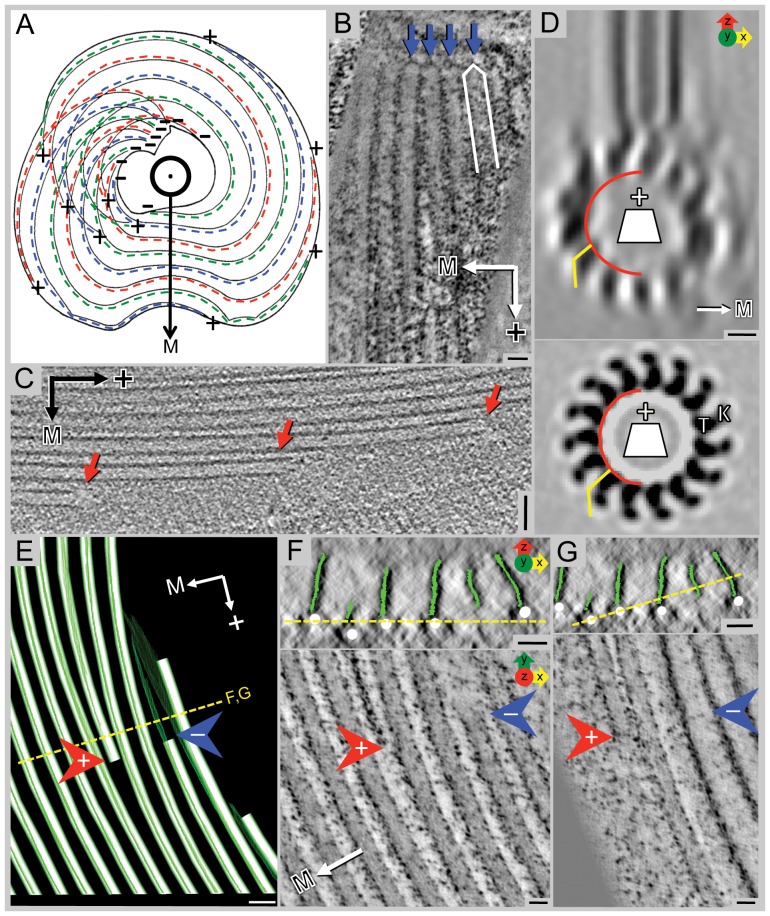
Figure 3. Polarity of ventral disc microtubules is unambiguous with minus-ends originating at dense bands or at the inside edge of the spiral.
A) Sketch showing the ventral disc with the dorsal side pointing torward the viewer. Microtubules start with their minus-ends near the overlap zone and spiral downward to the ventral side, thereby forming a left-handed helix. The repetitive units are on the margin-facing side (→M) of the microtubules (dotted colored lines). B) A 10 nm plastic-tomographic slice shows capped microtubule ends (blue arrows) at the dense bands, indicating their minus-ends, while panel C) shows open microtubule ends (red arrows) at the periphery of the disc, typical for plus-ends. D) An end-on view from a helical reconstruction of a bovine microtubule decorated with kinesin-1 motor domains (K) (for example see [61]); when viewed from the minus-end, tubulin (T) shows a right-handed slew while globular microtubule-associated proteins (MAPs) such as kinesin motor domains often bend torward the left (lower panel). The same pattern is visible in the 3-D average of the tomographic reconstruction (upper panel), though with less clarity due to the missing wedge effects. E) A portion of the model of the plastic-section tomogram from Figure 1D showing a plus-end (red arrow) of a microtubule that is ending within the spiral and a minus-end (blue arrow) beginning at the inner edge of the spiral. The microribbons (green) of the inserted microtubules (white) are proximal to the minus-end (blue arrow) of the microtubule. F, G) The upper panels show the plastic-section tomogram in cross-section with the microribbons modeled in green and microtubules in white. The yellow line shows the line of rotation 90° to make the views in the lower panels. The microtubule ending within the spiral (red arrow) is slightly below the neighboring microtubules. The microtubule beginning at the inner edge of the spiral (blue arrow) starts above the neighboring microtubules. Scale bars in B and C = 50 nm; D = 5 nm; E = 50 nm; F and G = 25 nm. Panel A: adapted with permission from [11].

