
Figure 2.
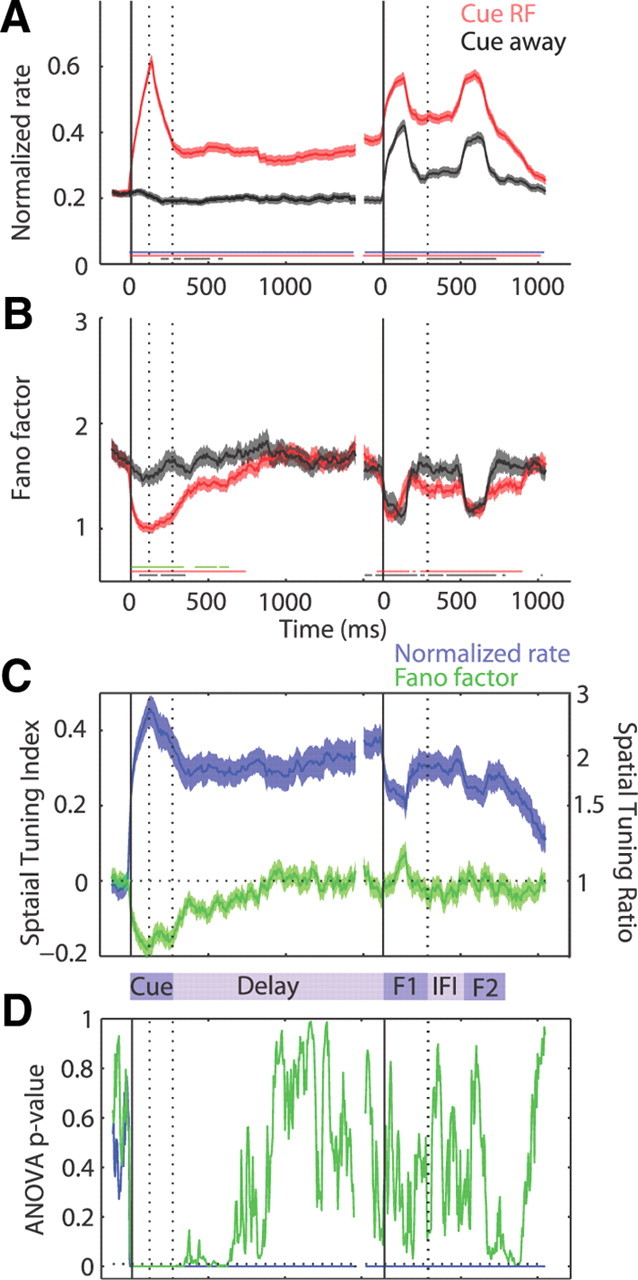
Time course of FR and FF. A, Average normalized FR of 126 FEF neurons, in a sliding 150 ms window, aligned to the onset of the cue (left solid vertical line) and the onset of the first presentation of the stimulus array (right solid vertical line) on correct trials in which the monkey was cued to attend to the RF location (red) and cued to attend away (gray). The vertical dotted lines indicate the range of offset times for the cue and first flash. Only no-change trials are included on the right. The thin lines along the bottom of the plot show intervals of significance, stepped every 10 ms: blue represents significant difference between the Cue RF and Cue away condition, red represents significant difference between the Cue RF condition and baseline, and black represents significant difference between the Cue away condition and baseline (Wilcoxon's signed rank, p < 0.01 for each). B, Corresponding FF. Conventions are the same as above, except the thin green line represents intervals of significant difference between the Cue RF and Cue away condition. C, Average STI for FR (blue) and FF (green), calculated using the respective values in Cue RF and Cue away conditions. Corresponding STR values on the secondary y-axis on the right were converted from the average STI values. The horizontal dotted line marks the zero value. D, Repeated-measures ANOVA p value for the FR (blue) and FF (green) values across all six cue locations. The horizontal dotted line marks 0.05 for reference. Error bars indicate SEM. F1, Flash 1; IFI, interflash interval; F2, flash 2.