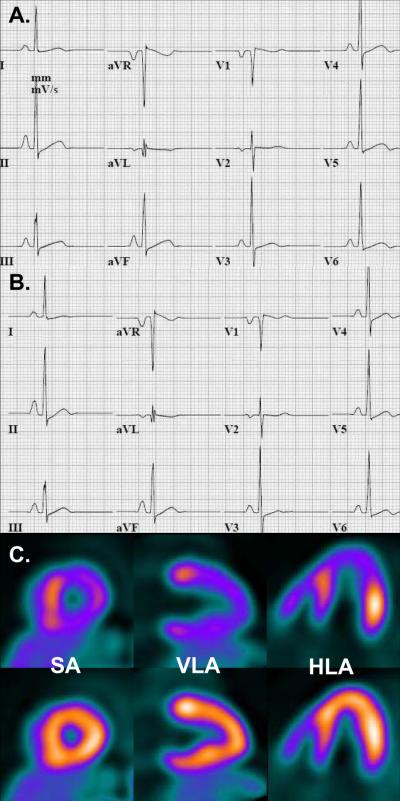
Figure 5.
ECG at baseline (A), during Regadenoson stress (B) and accompanying PET images (C, stress images top row, rest images bottom row) in an individual with hypertrophic cardiomyopathy who showed extensive and severe reversible myocardial perfusion abnormalities involving the entire anterior and inferior walls (C, top row images) despite minimal ST segment shift (<0.5 mm from baseline) during pharmacologic stress (B). SA = short axis, VLA = vertical long axis, HLA = horizontal long axis

