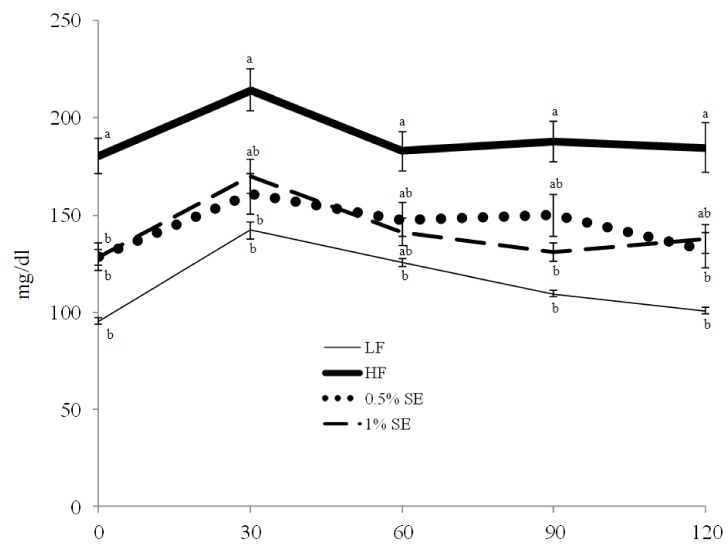
Fig. 1.
Effect of sorghum extract on the oral glucose tolerance test. Values are expressed as mean ± standard error; n = 7/group. LF, low fat diet; HF, high fat diet; 0.5% SE, high fat diet with 0.5% of dietary intake as sorghum extract, 1% SE, high fat diet with 1% of dietary intake as sorghum extract. Values with different letters are significantly different at P < 0.05 by analysis of variance followed by Duncan's multiple-range test.

