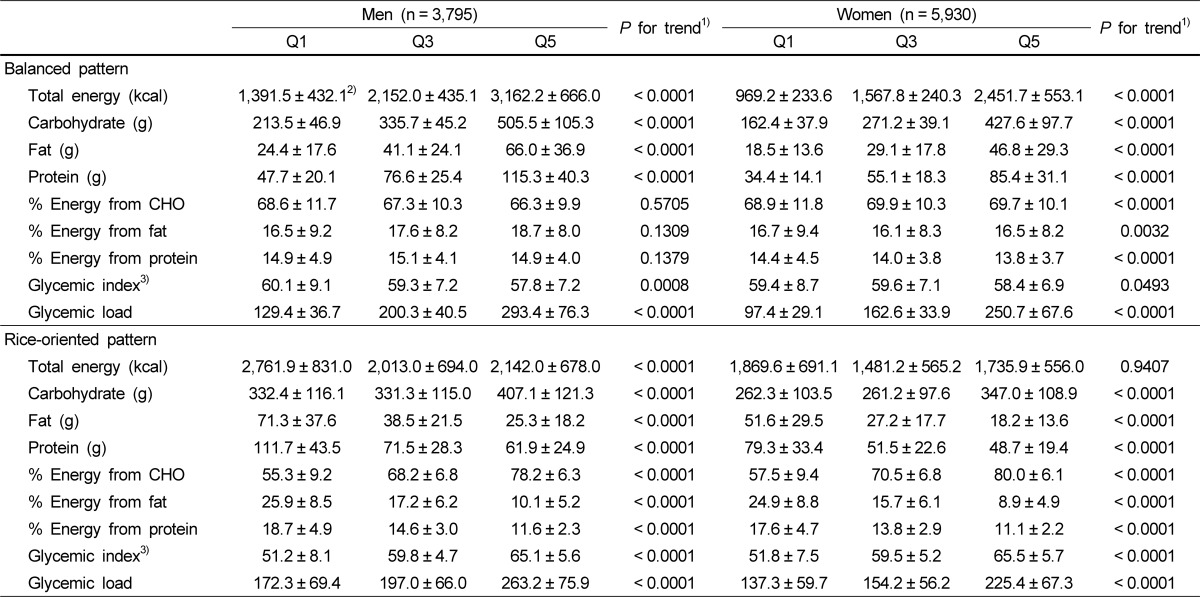
Table 3.
Mean nutrient intake across quintiles of dietary pattern scores
Q, quintiles of dietary pattern scores; CHO, carbohydrate
1)P for trend from general linear model (GLM) across quintiles of dietary pattern scores; adjusted for age (continuous), income (low, medium, or high), education (elementary, secondary, or college or more), body mass index (continuous), smoking (never, past, or current), alcohol use (yes or no), and physical activity (yes or no).
2)Mean ± standard deviation (all such values)
3)Glycemic index for glucose = 100

