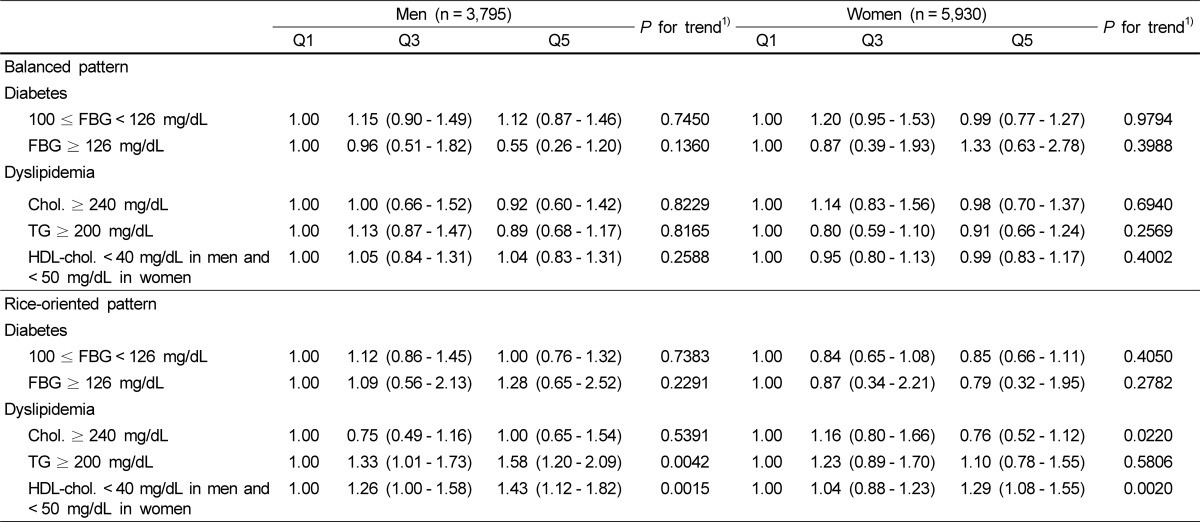
Table 4.
Multivariate adjusted odds ratios (ORs) and 95% confidence intervals (CIs) for diabetes and dyslipidemia across quintiles of dietary pattern scores
Q, quintiles of dietary pattern scores; FBG, fasting blood glucose; Chol., cholesterol; TG, triglycerides; HDL-chol., high density lipoprotein-cholesterol
1)P for trend from logistic regression analysis across quintiles of dietary pattern scores; adjusted for age (continuous), income (low, medium, or high), education (elementary, secondary, or college or more), body mass index (continuous), smoking (never, past, or current), alcohol use (yes or no), physical activity (yes or no), and dietary pattern scores (continuous).

