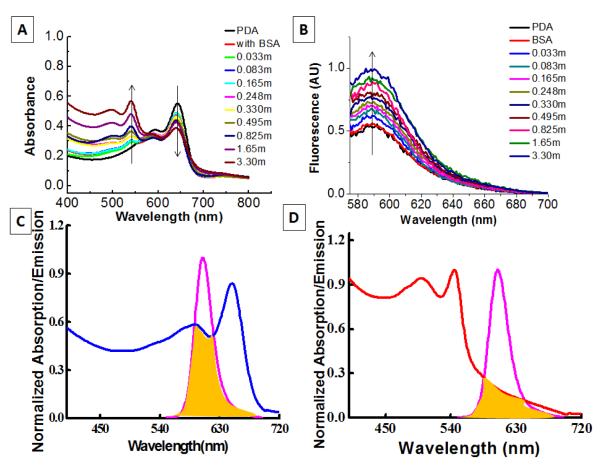
Figure 1.
Changes in the absorption (A) and emission (B) spectra of PDA liposomes (N) with the addition of E. Coli at different concentrations. Figure 1C and 1D shows the spectral overlap (J value) (yellow region) between SR 101 (Pink) and Blue PDA (blue) liposome solution and spectral overlap between SR 101 and Red PDA (red) liposome solution respectively. The concentration of E. Coli stock solution was 3.3 × 10⁷ E. Coli/mL while the concentration of BSA was 150 μg/mL. In Figure 1A and 1B, m stands for 107 E.Coli particles. For example, 0.033m means 0.033*107 of E.Coli particles. The excitation wavelength for FRET experiments was 560 nm.

