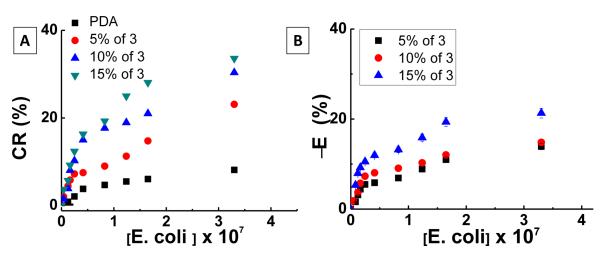
Figure 2.
(A) Colorimetric response (CR) of the liposomes-versus-E. coli concentration for liposomes N, (B) shows FRET efficiency for liposomes N. Minus sign in (B) denotes a decrease in the FRET efficiency after addition of E. Coli to the solution. CR and E were calculated using Eqs. 1 and 3 respectively.

