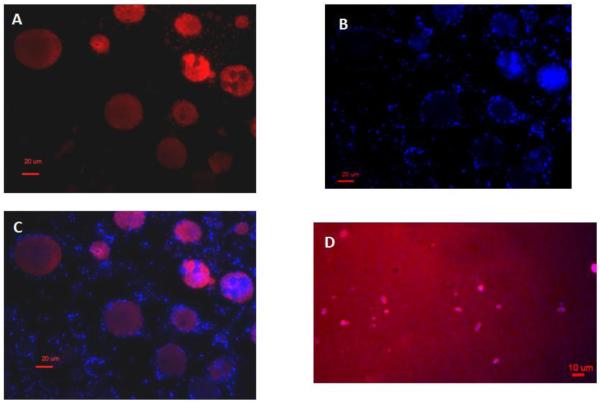
Figure 3.
(A) Fluorescence micrograph of SR-101tagged-GUV bound to excess amount of E. Coli. The red emission originated from SR-101. (B) DAPI-stained E. Coli bound to GUV showed blue emission. (C) Shows the composite of E. Coli-bound GUVs. (D) The fluorescence micrograph of nano-sized liposomes tagged with SR-101 bound on the surface of E. Coli (blue emission). Here the liposomes are totally covered with E. Coli surface. For these experiments, E. Coli was in excess (>20 times the liposome concentration). Please see experimental section for information on excitation and emission filters. The red emission was obtained using a 41004 Texas Red filter (exciting and emitting band widths of the filter used were 527-567 nm and 605-682 nm respectively). The blue emission was obtained using a DAPI filter (excitation and emission band widths were (349 ± 25) nm and (459 ± 25 nm).

